


Join our elite team of contributors!

👋 Welcome to the AutoViML Fan Club Page!
We just hit 3300 stars collectively for all AutoViML libraries on Github!!
AutoViML creates innovative Open Source libraries to make data scientists' and machine learning engineers' lives easier and more productive!
- 🤝 AutoViz Automatically Visualizes any dataset, any size with a single line of code. Now with Bokeh and Holoviews it can make your charts and dashboards interactive!
- 🤝 Auto_ViML Automatically builds multiple ML models with a single line of code. Uses scikit-learn, XGBoost and CatBoost.
- 🤝 Auto_TS Automatically builds ARIMA, SARIMAX, VAR, FB Prophet and XGBoost Models on Time Series data sets with a Single Line of Code. Now updated with DASK to handle millions of rows.
- 🤝 Featurewiz Uses advanced feature engineering strategies and select the best features from your data set fast with a single line of code. Now updated with DASK to handle millions of rows.
- 🤝 Deep_AutoViML Builds tensorflow keras models and pipelines for any data set, any size with text, image and tabular data, with a single line of code.
- 🤝 lazytransform Automatically transform all categorical, date-time, NLP variables to numeric in a single line of code, for any data, set any size.
- 🤝 pandas_dq Automatically find and fix data quality issues in your dataset with a single line of code, for pandas.
I keep getting requests to upgrade my packages to pandas-2.0. I have no problem to do so but if I upgrade your machines to pandas-2.0 the following things will break:
- dask
- lightgbm
- category_encoders
- imbalanced-learn
- scikit-learn
- matplotlib
- seaborn
I may have left out thousands of other packages that will break if I merely upgrade your machine to pandas-2.0 without upgrading all those 1000's of other packages to work with pandas-2.0.
In addition, some of you will have to upgrade your "python" version itself to "3.9 or higher". Are you willing to take such a major leap?
How many of us want to spend hours upgrading your python version and all its complexity, so that every package is fixed to work in the new python version?
I am not.
So please upgrade your individual machine to whatever these "2.0" libraries supposedly provide and "enjoy". But until then, stop pestering others to do so.
Feb-2024: Added "Auto Encoders" for automatic feature extraction to featurewiz library for #feature-extraction
On Feb 8, 2024, we released a major update to our popular "featurewiz" library that will transform your input into a latent space with a dimension of latent_dim. This lower dimension (similar to PCA) will enable you to extract the best patterns in your data for the toughest imbalanced class and multi-class problems. Try it and let us know!
how to use autoencoders in featurewiz

On April 2, 2023, we released a major new Python library called "pandas_dq" that will automatically find and fix data quality issuesin your train and test dataframes in a single line of code, for any data, set any size.
how many pixels wide is my screen

April-2022: Released a major new python library "lazytransform" #featureengineering #featureselection
On April 3, 2022, we released a major new Python library called "lazytransform" that will automatically transform all categorical, date-time, NLP variables to numeric in a single line of code, for any data, set any size.

Jan-2022: Major upgrade to featurewiz: you can now perform feature selection thru fit and transform #MLOps #featureselection
As of version 0.0.90, featurewiz has a scikit-learn compatible feature selection transformer called FeatureWiz. You can use it to perform fit and predict as follows. You will get a Scikit-Learn Transformer object that you can add it to other data pipelines in MLops to select the top variables from your dataset.

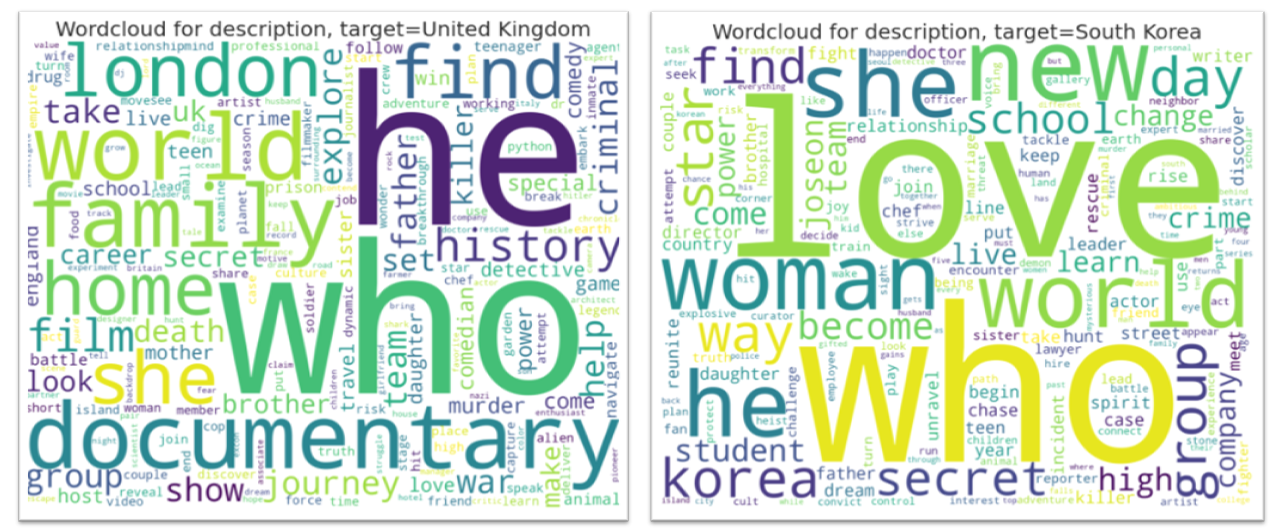
AutoViz can now create Wordclouds automatically for your NLP variables in data. It detects NLP variables automatically and creates wordclouds for them.
Dec 21, 2021: AutoViz now runs on Docker containers as part of MLOps pipelines. Check out Orchest.io
We are excited to announce that AutoViz and Deep_AutoViML are now available as containerized applications on Docker. This means that you can build data pipelines using a fantastic tool like orchest.io to build MLOps pipelines visually. Here are two sample pipelines we have created:
AutoViz pipeline: https://lnkd.in/g5uC-z66 Deep_AutoViML pipeline: https://lnkd.in/gdnWTqCG
You can find more examples and a wonderful video on orchest's web site

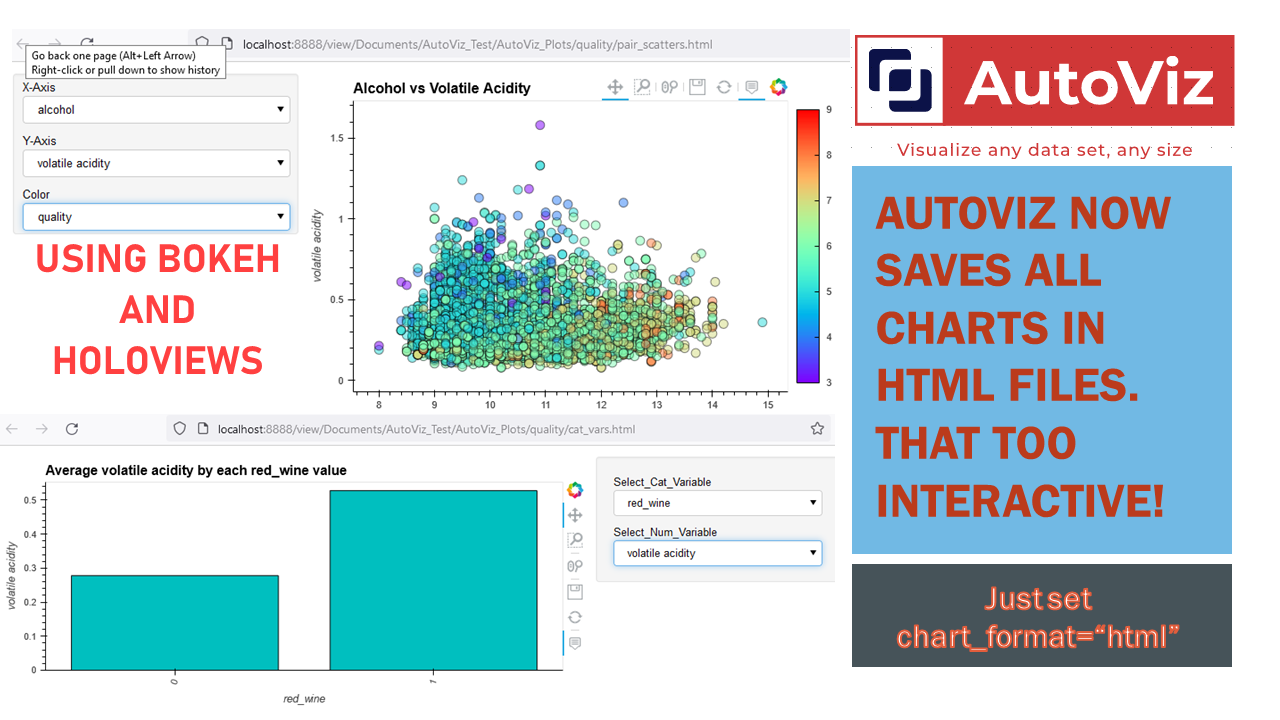
Dec-17-2021 AutoViz now uses HoloViews to display dashboards with Bokeh and save them as Dynamic HTML for web serving #HTML #Bokeh #Holoviews
Now you can use AutoViz to create Interactive Bokeh charts and dashboards (see below) either in Jupyter Notebooks or in the browser. Use chart_format as follows:
chart_format='bokeh': interactive Bokeh dashboards are plotted in Jupyter Notebooks.chart_format='server', dashboards will pop up for each kind of chart on your web browser.chart_format='html', interactive Bokeh charts will be silently saved as Dynamic HTML files underAutoViz_Plotsdirectory
![]()
![]()