This package allows the user to construct and model Galaxian Luminosity Functions using the estimator and Schechter function.


Use the package manager pip to install lumfunc.
pip install lumfuncKeep the package up to date to access all commands.
pip install --upgrade lumfuncImport the module in your Python code.
import lumfunc as lfLoad the catalogued data from survey. Usually stored in .fits or .csv files.
import numpy as np
import pandas as pd

# test data (photometric galaxian survey)
data_table = pd.read_csv('catalogue_test.csv')

ID_list = np.array(data_table['ID'])

RA_list = np.array(data_table['RA'])
Dec_list = np.array(data_table['Dec'])

u_app_mag_list = np.array(data_table['u_mag'])
u_app_mag_err_list = np.array(data_table['u_mag_err'])
g_app_mag_list = np.array(data_table['g_mag'])
g_app_mag_err_list = np.array(data_table['g_mag_err'])
r_app_mag_list = np.array(data_table['r_mag'])
r_app_mag_err_list = np.array(data_table['r_mag_err'])
i_app_mag_list = np.array(data_table['i_mag'])
i_app_mag_err_list = np.array(data_table['i_mag_err'])
Z_app_mag_list = np.array(data_table['Z_mag'])
Z_app_mag_err_list = np.array(data_table['Z_mag_err'])
Y_app_mag_list = np.array(data_table['Y_mag'])
Y_app_mag_err_list = np.array(data_table['Y_mag_err'])
J_app_mag_list = np.array(data_table['J_mag'])
J_app_mag_err_list = np.array(data_table['J_mag_err'])
H_app_mag_list = np.array(data_table['H_mag'])
H_app_mag_err_list = np.array(data_table['H_mag_err'])
K_app_mag_list = np.array(data_table['K_mag'])
K_app_mag_err_list = np.array(data_table['K_mag_err'])

z_photo_list = np.array(data_table['z_photo'])
z_spec_list = np.array(data_table['z_spec'])get_maggy( ): Convert the measurements of flux in magnitudes to maggies
Return maggies from magnitudes.
r_maggies_list = lf.get_maggy(r_app_mag_list)
print(r_maggies_list[0:4])
# returns
# [2.17126084e-08 1.88972757e-08 9.39864400e-09 3.74726494e-08]

# rudimentarily:
r_maggies_result = lf.get_maggy(np.array([19.15822, 19.309002, 20.067337, 18.565714]))
print(r_maggies_result[0:4])
# returns
# [2.17126084e-08 1.88972757e-08 9.39864400e-09 3.74726494e-08]
get_maggy_inv_var( ): Convert the magnitude errors to maggy inverse variances
Return maggy inverse variances from maggies and magnitude errors.
r_maggy_inv_var_list = lf.get_maggy_inv_var(r_maggies_list, r_app_mag_err_list)
print(r_maggy_inv_var_list[0:4])
# returns
# [2.61353653e+20 2.21539925e+20 2.63295704e+20 1.52030876e+20]

# rudimentarily:
r_maggy_inv_var_result = lf.get_maggy_inv_var(
    np.array([2.17126084e-08, 1.88972757e-08, 9.39864400e-09, 3.74726494e-08]),
    np.array([0.00309313, 0.0038601, 0.0071193, 0.00234987]))
print(r_maggy_inv_var_result[0:4])
# returns
# [2.61353484e+20 2.21540499e+20 2.63295631e+20 1.52031005e+20]
get_obs_maggies_file( ): Save calculated maggies and inverse variances in a file
Calculate maggy and inverse variance values from apparent magnitude and their error values and save the values in a space delimited csv file with columns (without headers):
redshift u_maggy g_maggy r_maggy... u_inv_var g_inv_var r_inv_var...
WARNING: any pre-existing file with the same name are over-written.
For 'ugriz' bands:
ugriz_test_obs_maggies_file_path = 'obs_maggies_ugriz_test.csv'
ugriz_test_bands = 'ugriz'
lf.get_obs_maggies_file(ugriz_test_obs_maggies_file_path,
                        ugriz_test_bands,
                        z_photo_list,
                        u_app_mag_list,
                        g_app_mag_list,
                        r_app_mag_list,
                        i_app_mag_list,
                        Z_app_mag_list,
                        u_app_mag_err_list = u_app_mag_err_list,
                        g_app_mag_err_list = g_app_mag_err_list,
                        r_app_mag_err_list = r_app_mag_err_list,
                        i_app_mag_err_list = i_app_mag_err_list,
                        Z_app_mag_err_list = Z_app_mag_err_list)
# saves file obs_maggies_ugriz_test.csv
Or, for 'ugriZYJHKs' bands:
ugriZYJHKs_test_obs_maggies_file_path = 'obs_maggies_ugriZYJHKs_test.csv'
ugriZYJHKs_test_bands = 'ugriZYJHKs'
lf.get_obs_maggies_file(ugriZYJHKs_test_obs_maggies_file_path,
                        ugriZYJHKs_test_bands,
                        z_photo_list,
                        u_app_mag_list,
                        g_app_mag_list,
                        r_app_mag_list,
                        i_app_mag_list,
                        Z_app_mag_list,
                        Y_app_mag_list = Y_app_mag_list,
                        J_app_mag_list = J_app_mag_list,
                        H_app_mag_list = H_app_mag_list,
                        Ks_app_mag_list = K_app_mag_list,
                        u_app_mag_err_list = u_app_mag_err_list,
                        g_app_mag_err_list = g_app_mag_err_list,
                        r_app_mag_err_list = r_app_mag_err_list,
                        i_app_mag_err_list = i_app_mag_err_list,
                        Z_app_mag_err_list = Z_app_mag_err_list,
                        Y_app_mag_err_list = Y_app_mag_err_list,
                        J_app_mag_err_list = J_app_mag_err_list,
                        H_app_mag_err_list = H_app_mag_err_list,
                        Ks_app_mag_err_list = K_app_mag_err_list)
# saves file obs_maggies_ugriZYJHKs_test.csv
get_rec_maggies_files( ): Save reconstructed maggies at required redshifts in a file
Define an array of required redshift values to reconstruct the observed maggy at.
z_values = np.arange(0.00, 1.00, 0.01)
rec_z_list = np.around(z_values, decimals=2)
Using file from function get_obs_maggies_file(), obtain reconstructed maggy values by best-fitting galaxy SEDs on data using templates, filter transmission curves and functions from kcorrect_python package, and save the reconstructed maggy values in a space delimited csv file with columns (without headers):
redshift rec_u_maggy rec_g_maggy rec_r_maggy...
WARNING: pre-existing file with the same name are over-written.
Example, for 'ugriz' bands:
ugriz_test_n_bands = 5
lf.get_rec_maggies_files(ugriz_test_obs_maggies_file_path,
                         ugriz_test_n_bands,
                         rec_z_list,
                         rec_maggies_outfile_affix='ugriz_test',
                         survey='sdss',
                         band_z_shift=0.0,
                         template_vmatrix_file_path='vmatrix.default.dat',
                         template_lambda_file_path='lambda.default.dat',
                         filters_list_file_path='sdss_filters.dat')
# saves files maggies_at_z[redshift-value]_ugriz_test.csv
Or, for 'ugriZYJHKs' bands:
ugriZYJHKs_test_n_bands = 9
lf.get_rec_maggies_files(ugriZYJHKs_test_obs_maggies_file_path,
                         ugriZYJHKs_test_n_bands,
                         rec_z_list,
                         rec_maggies_outfile_affix='ugriZYJHKs_test',
                         survey='test',
                         band_z_shift=0.0,
                         template_vmatrix_file_path='vmatrix.test.dat',
                         template_lambda_file_path='lambda.test.dat',
                         filters_list_file_path='test_filters.dat')
# saves files maggies_at_z[redshift-value]_ugriZYJHKs_test.csv
get_rest_maggy_ratio_file( ): Save calculated rest-frame maggy ratios in a file
Calculate rest-frame maggy ratios i.e. (obs_maggy/rest_maggy), and save them in a csv file with 3 space delimited columns, of headers:
ID rest_z maggy_ratio
WARNING: pre-existing file with the same name are over-written.
r_test_band_index = 3
ugriz_test_rest_maggies_file_path = 'maggies_at_z0.0_ugriz_test.csv'
lf.get_rest_maggy_ratio_file(ID_list,
                             ugriz_test_obs_maggies_file_path,
                             ugriz_test_rest_maggies_file_path,
                             r_test_band_index,
                             rest_maggy_ratio_outfile_affix='r_ugriz_test')
# saves file rest_maggy_ratios_ugriz_test.csv
get_rest_mag( ): Convert the measured apparent magnitudes into rest-frame magnitudes using the catalogue data and rest-frame maggy ratios
Load maggy ratios output file from the get_rest_maggy_ratio_file() function.
r_maggy_ratios_table = pd.read_csv('rest_maggy_ratios_r_ugriz_test.csv', delimiter=' ')
r_maggy_ratio_list = np.array(r_maggy_ratios_table['maggy_ratio'])
Return rest-frame magnitudes from the apparent magnitudes, redshifts and maggy ratios.
r_rest_mag_list = lf.get_rest_mag(z_photo_list, r_app_mag_list, r_maggy_ratio_list)
print(r_rest_mag_list[0:4])
# returns
# [-22.51871096 -20.36706085 -23.67084707 -23.68118244]

# rudimentarily:
r_rest_mag_result = lf.get_rest_mag(np.array([0.34, 0.17, 0.61, 0.41]),
                                  np.array([19.15822, 19.309002, 20.067337, 18.565714]),
                                  np.array([0.69938735, 0.90226577, 0.43780755, 0.59193305]))
print(r_rest_mag_result[0:4])
# returns
# [-22.50048221 -20.3671756 -23.61190369 -23.75133512]get_maggy_ratio_file( ): Save calculated reconstructed maggy ratios in a file
Calculate reconstructed maggy ratios i.e. (rec_maggy/rest_maggy), and save them in a csv file with 3 space delimited columns, of headers:
ID rest_z maggy_ratio
WARNING: pre-existing file with the same name are over-written.
ugriz_test_rec_maggies_file_path = 'maggies_at_z0.01_ugriz_test.csv'
lf.get_maggy_ratio_file(ID_list,
                        ugriz_test_rest_maggies_file_path,
                        ugriz_test_rec_maggies_file_path,
                        0.01,
                        r_test_band_index,
                        maggy_ratio_outfile_affix='r_ugriz_test')
# saves file maggy_ratios_at_z0.01_ugriz_test.csv
get_all_maggy_ratios_file( ): Consolidate all files of calculated reconstructed maggy ratios
Perform get_maggy_ratio_file() at each redshift value in rec_z_list in a separate csv file and consolidate all maggy ratios by joining the above files in the order of rec_z_list in a single csv file with 3 space delimited columns, of headers:
ID rec_z maggy_ratio
The file with all maggy ratios can be used to calculate .
WARNING: pre-existing file with same name will be over-written.
lf.get_all_maggy_ratios_file(rec_z_list,
                             ID_list,
                             r_test_band_index,
                             maggies_and_out_files_affix='ugriz_test')
# saves files maggy_ratios_at_z[redshift-value]_ugriz_test.csv and all_maggy_ratios_ugriz_test.csv
get_volume( ): Convert the survey area in square degrees and respective redshift of each data point into comoving volumes. So, estimate  from
from  values
Load the file.
zmax_table = pd.read_csv('zmax_test.csv', delimiter=' ')
z_max_list = np.array(zmax_table['zmax'])
Return comoving volume from the survey area and redshifts.
survey_area = 2.5 #sq. degrees
Vmax_list = lf.get_volume(survey_area, z_max_list)
print(Vmax_list[:4])
# returns
# [1756716.17055371  178625.22629838 2447025.53293128 2287569.94863823]

# rudimentarily:
Vmax_result = lf.get_volume(2.5, np.array([0.50523681, 0.21884399, 0.57489149, 0.55985663]))
print(Vmax_result[:4])
# returns
# [1756716.14012229  178625.22858948 2447025.55434235 2287569.98290078]
get_binned_phi( ): Bin and weigh galaxy counts per magnitude by 
Return M, M errors and phi from the rest-frame magnitudes, values and number of bins.
n_bins = 10
M_list, M_err_list, phi_list = lf.get_binned_phi(r_rest_mag_list, Vmax_list, n_bins)
print(M_list)
# returns
# [-24.62894309 -23.40451281 -22.18008254 -20.95565226 -19.73122199
#  -18.50679171 -17.28236144 -16.05793116 -14.83350089 -13.60907061]
print(M_err_list)
# returns
# [0.61221514 0.61221514 0.61221514 0.61221514 0.61221514 0.61221514
#  0.61221514 0.61221514 0.61221514 0.61221514]
print(phi_list)
# returns
# [2.90491673e+02 2.65797786e+02 9.55747321e-05 2.54944447e-04
#  6.24753189e-04 1.07591651e-03 1.91052839e-03 5.62455612e-03
#  3.86037842e-03 6.41768497e-02]

# OR a rudimentarily example:
M_result, M_err_result, phi_result = lf.get_binned_phi(
    np.array([-23, -21, -19, -22, -23, -23, -22, -23, -22, -22, -19, -21]),
    np.array([
        8e+08, 2e+08, 2e+07, 3e+08, 6e+08, 6e+08, 4e+08, 7e+08, 5e+08, 6e+08,
        7e+06, 1e+08
    ]), 4)
print(M_result)
# returns
# [-22.5 -21.5 -20.5 -19.5]
print(M_err_result)
# returns
# [0.5 0.5 0.5 0.5]
print(phi_result)
# returns
# [1.06411667e-08 1.02900000e-08 0.00000000e+00 1.32300000e-07]get_patch_centers( ): First, divide uniformly and randomly simulated data points over the survey area into equally distributed and equally sized patches
Load RA and Dec from uniformly distributed catalogue.
uniform_data_table = pd.read_csv('uniform_catalogue_test.csv')
uniform_RA_list = np.array(uniform_data_table['uniform_RA'])
uniform_Dec_list = np.array(uniform_data_table['uniform_Dec'])
Calculates n_patches centers (RA,Dec) from RA, Dec and number of patches and saves in a csv file with 2 space delimited columns (without headers):
RA Dec
Function does not overwrite any existing file with the same name. File need not be updated with every run.
n_patches = 10
lf.get_patch_centers(uniform_RA_list,
                     uniform_Dec_list,
                     n_patches,
                     survey='kids',
                     max_iterations=int(100),
                     tolerance=1.0e-2,
                     patch_centers_outfile_affix='ugriz_test')
# saves file patch_centers_tol0.01_ugriz_test.csv
get_patch_labels( ): Then, use the patch centers to label the survey data points by equally distributed and equally sized patches
Return patch labels for each data point from RA, Dec, number of patches and patch center guesses file.
ugriz_test_patch_centers_file_path = 'patch_centers_tol0.01_ugriz_test.csv'
labels = lf.get_patch_labels(RA_list,
                             Dec_list,
                             n_patches,
                             ugriz_test_patch_centers_file_path,
                             survey='kids',
                             numba_installed=True,
                             plot_savename='test_patches.png')
# displays plot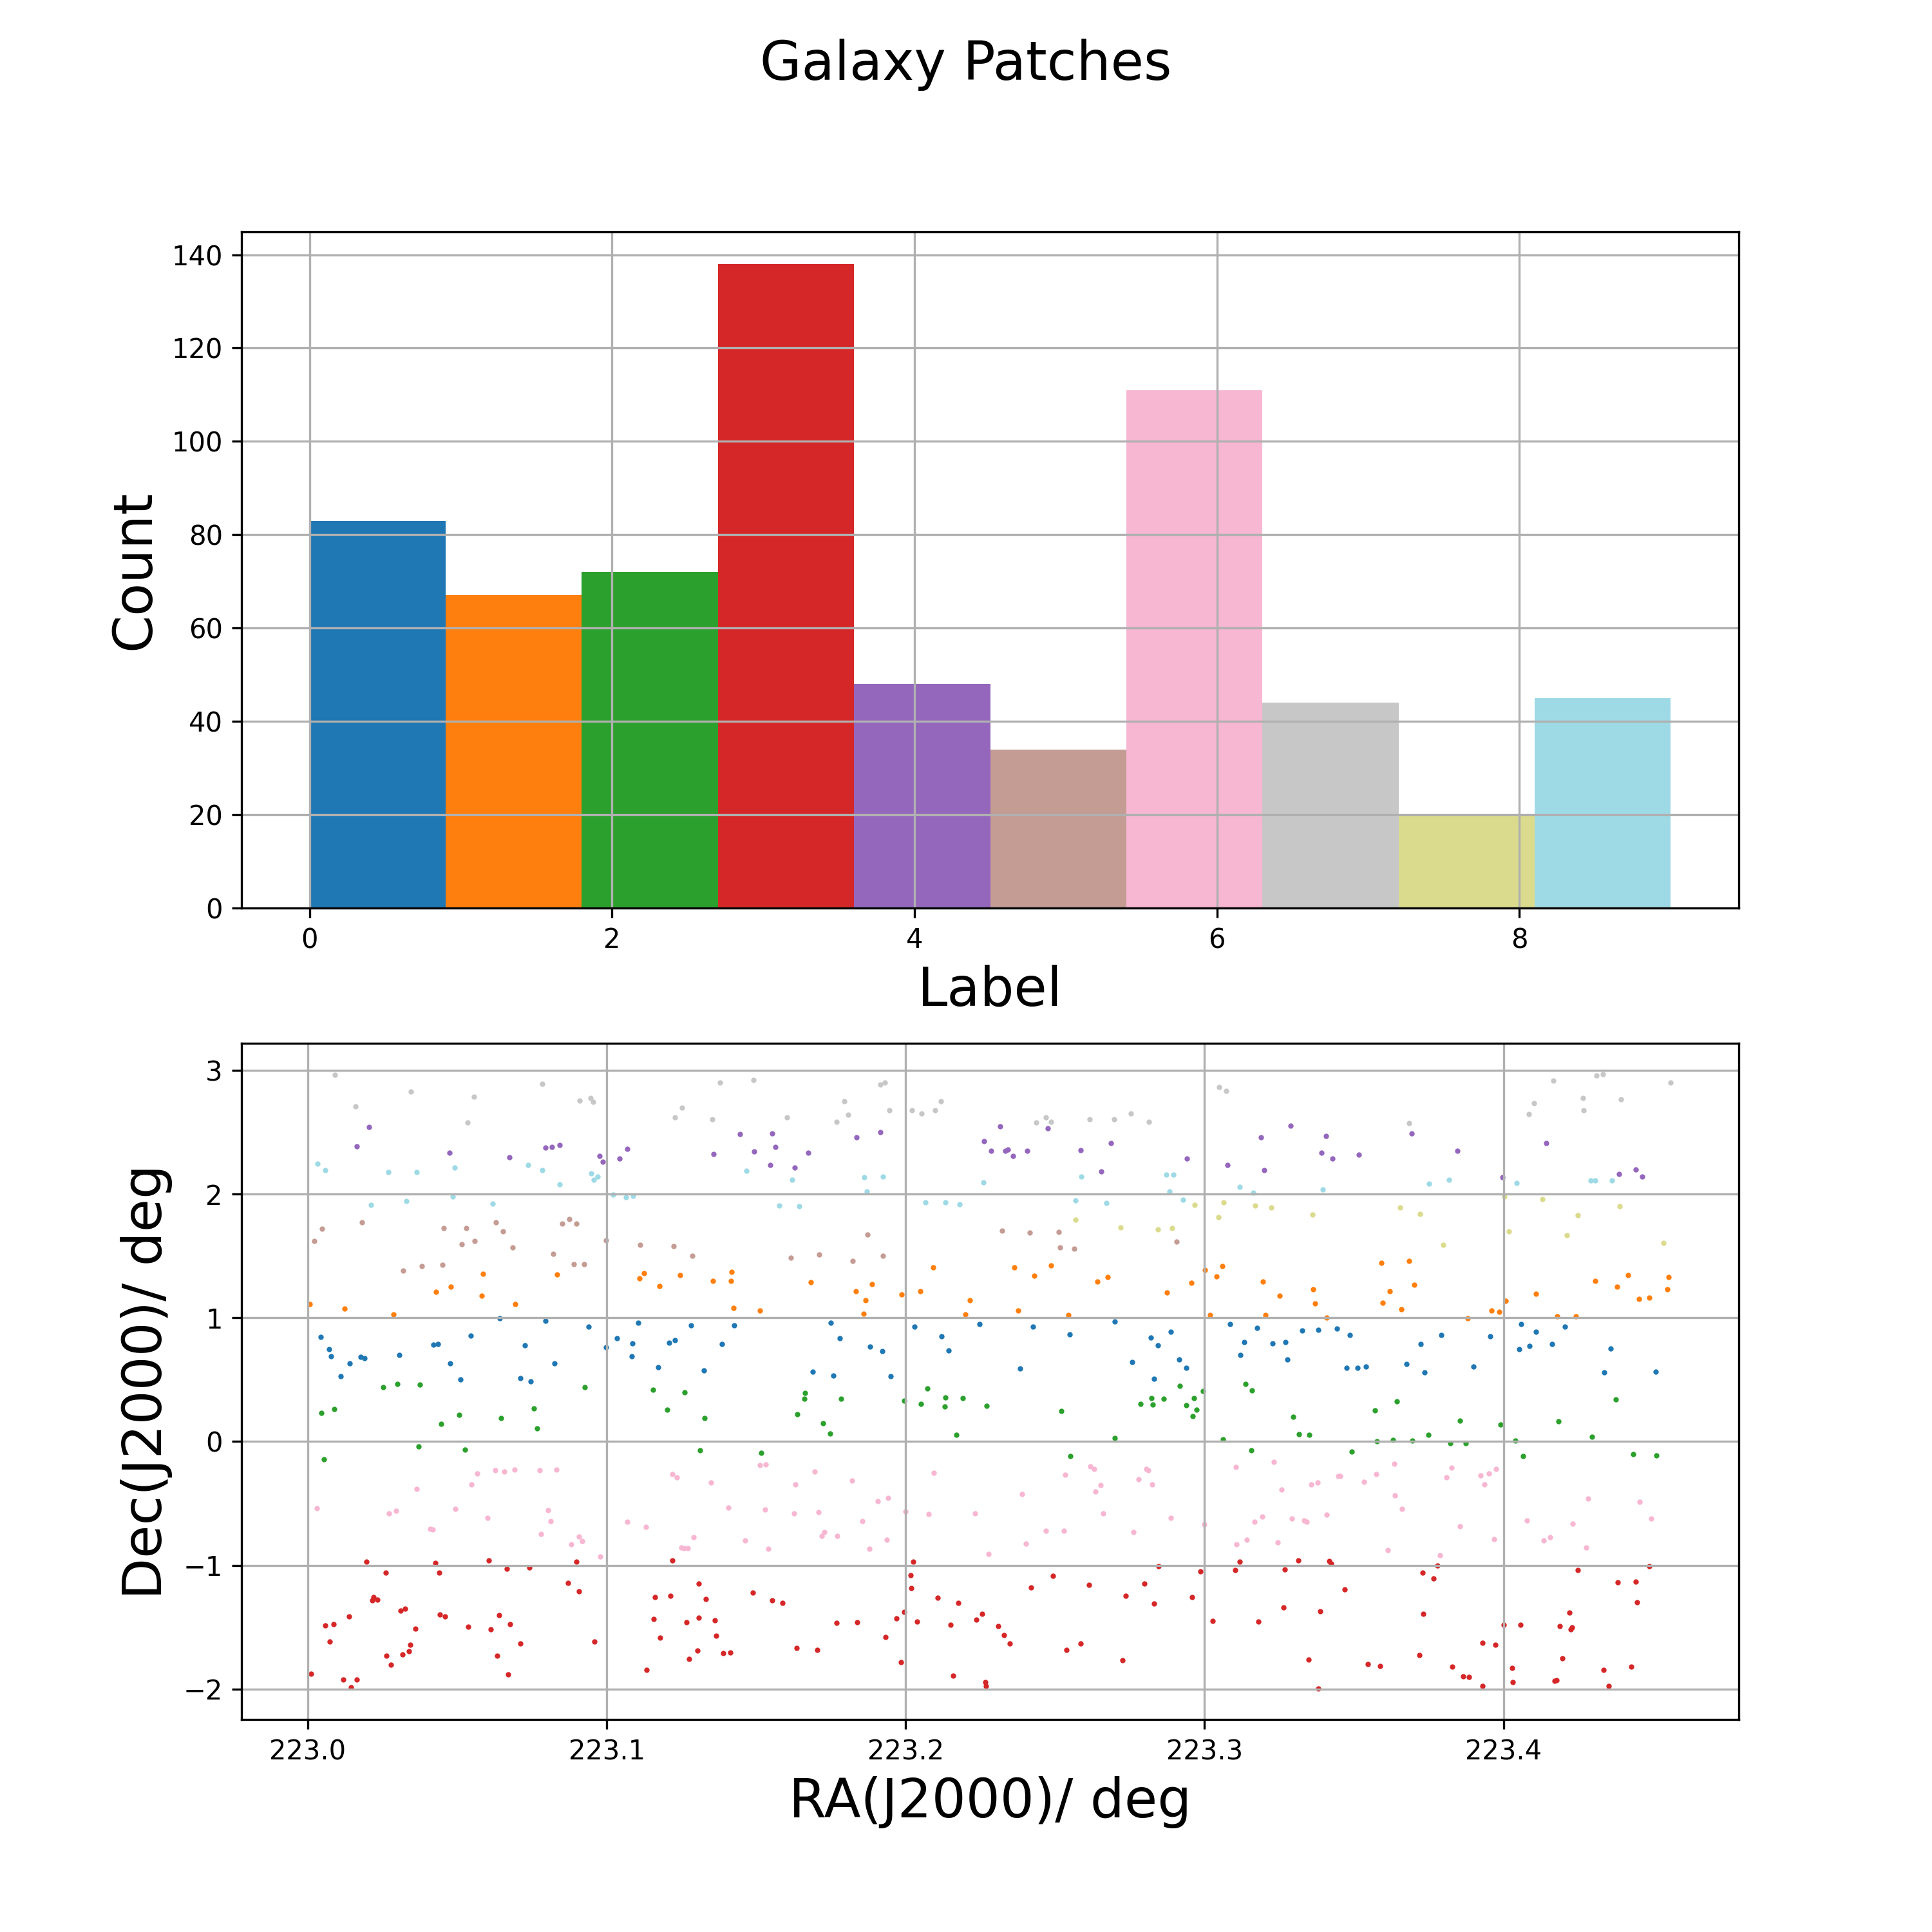
get_binned_phi_error( ): Finally, use the patch labels to compute the spatial variances of 
Return error on phi from rest-frame magnitude, maximum observed volume, labels, number of patches and number of bins.
phi_err_list = lf.get_binned_phi_error(r_rest_mag_list, Vmax_list, labels, n_patches, n_bins)
print(phi_err_list)
# returns
# [8.10939765e+02 6.07817000e+02 4.36417469e-05 1.97040124e-04
#  5.48618065e-04 4.65431861e-04 5.77332857e-04 4.59036072e-03
# 2.21037277e-03 1.64362438e-01]get_plot( ): Perform get_binned_phi() , get_patch_labels() and get_binned_phi_error() functions using only one composite function and visualise the luminsoity function
Plot the weighted luminosity function, binned by magnitude.
M_list, M_err_list, phi_list, phi_err_list = lf.get_plot(
    r_rest_mag_list,
    Vmax_list,
    n_bins,
    RA_list,
    Dec_list,
    n_patches,
    ugriz_test_patch_centers_file_path,
    survey='kids',
    numba_installed=True,
    plot_savename='test_LF.png')

print(plot_M_list)
# returns
# [-24.62894309 -23.40451281 -22.18008254 -20.95565226 -19.73122199
#  -18.50679171 -17.28236144 -16.05793116 -14.83350089 -13.60907061]
print(plot_M_err_list)
# returns
# [0.61221514 0.61221514 0.61221514 0.61221514 0.61221514 0.61221514
#  0.61221514 0.61221514 0.61221514 0.61221514]
print(plot_phi_list)
# returns
# [2.90491673e+02 2.65797786e+02 9.55747321e-05 2.54944447e-04
#  6.24753189e-04 1.07591651e-03 1.91052839e-03 5.62455612e-03
#  3.86037842e-03 6.41768497e-02]
print(plot_phi_err_list)
# returns
# [8.10939765e+02 6.07817000e+02 4.36417469e-05 1.97040124e-04
#  5.48618065e-04 4.65431861e-04 5.77332857e-04 4.59036072e-03
#  2.21037277e-03 1.64362438e-01]

# displays plot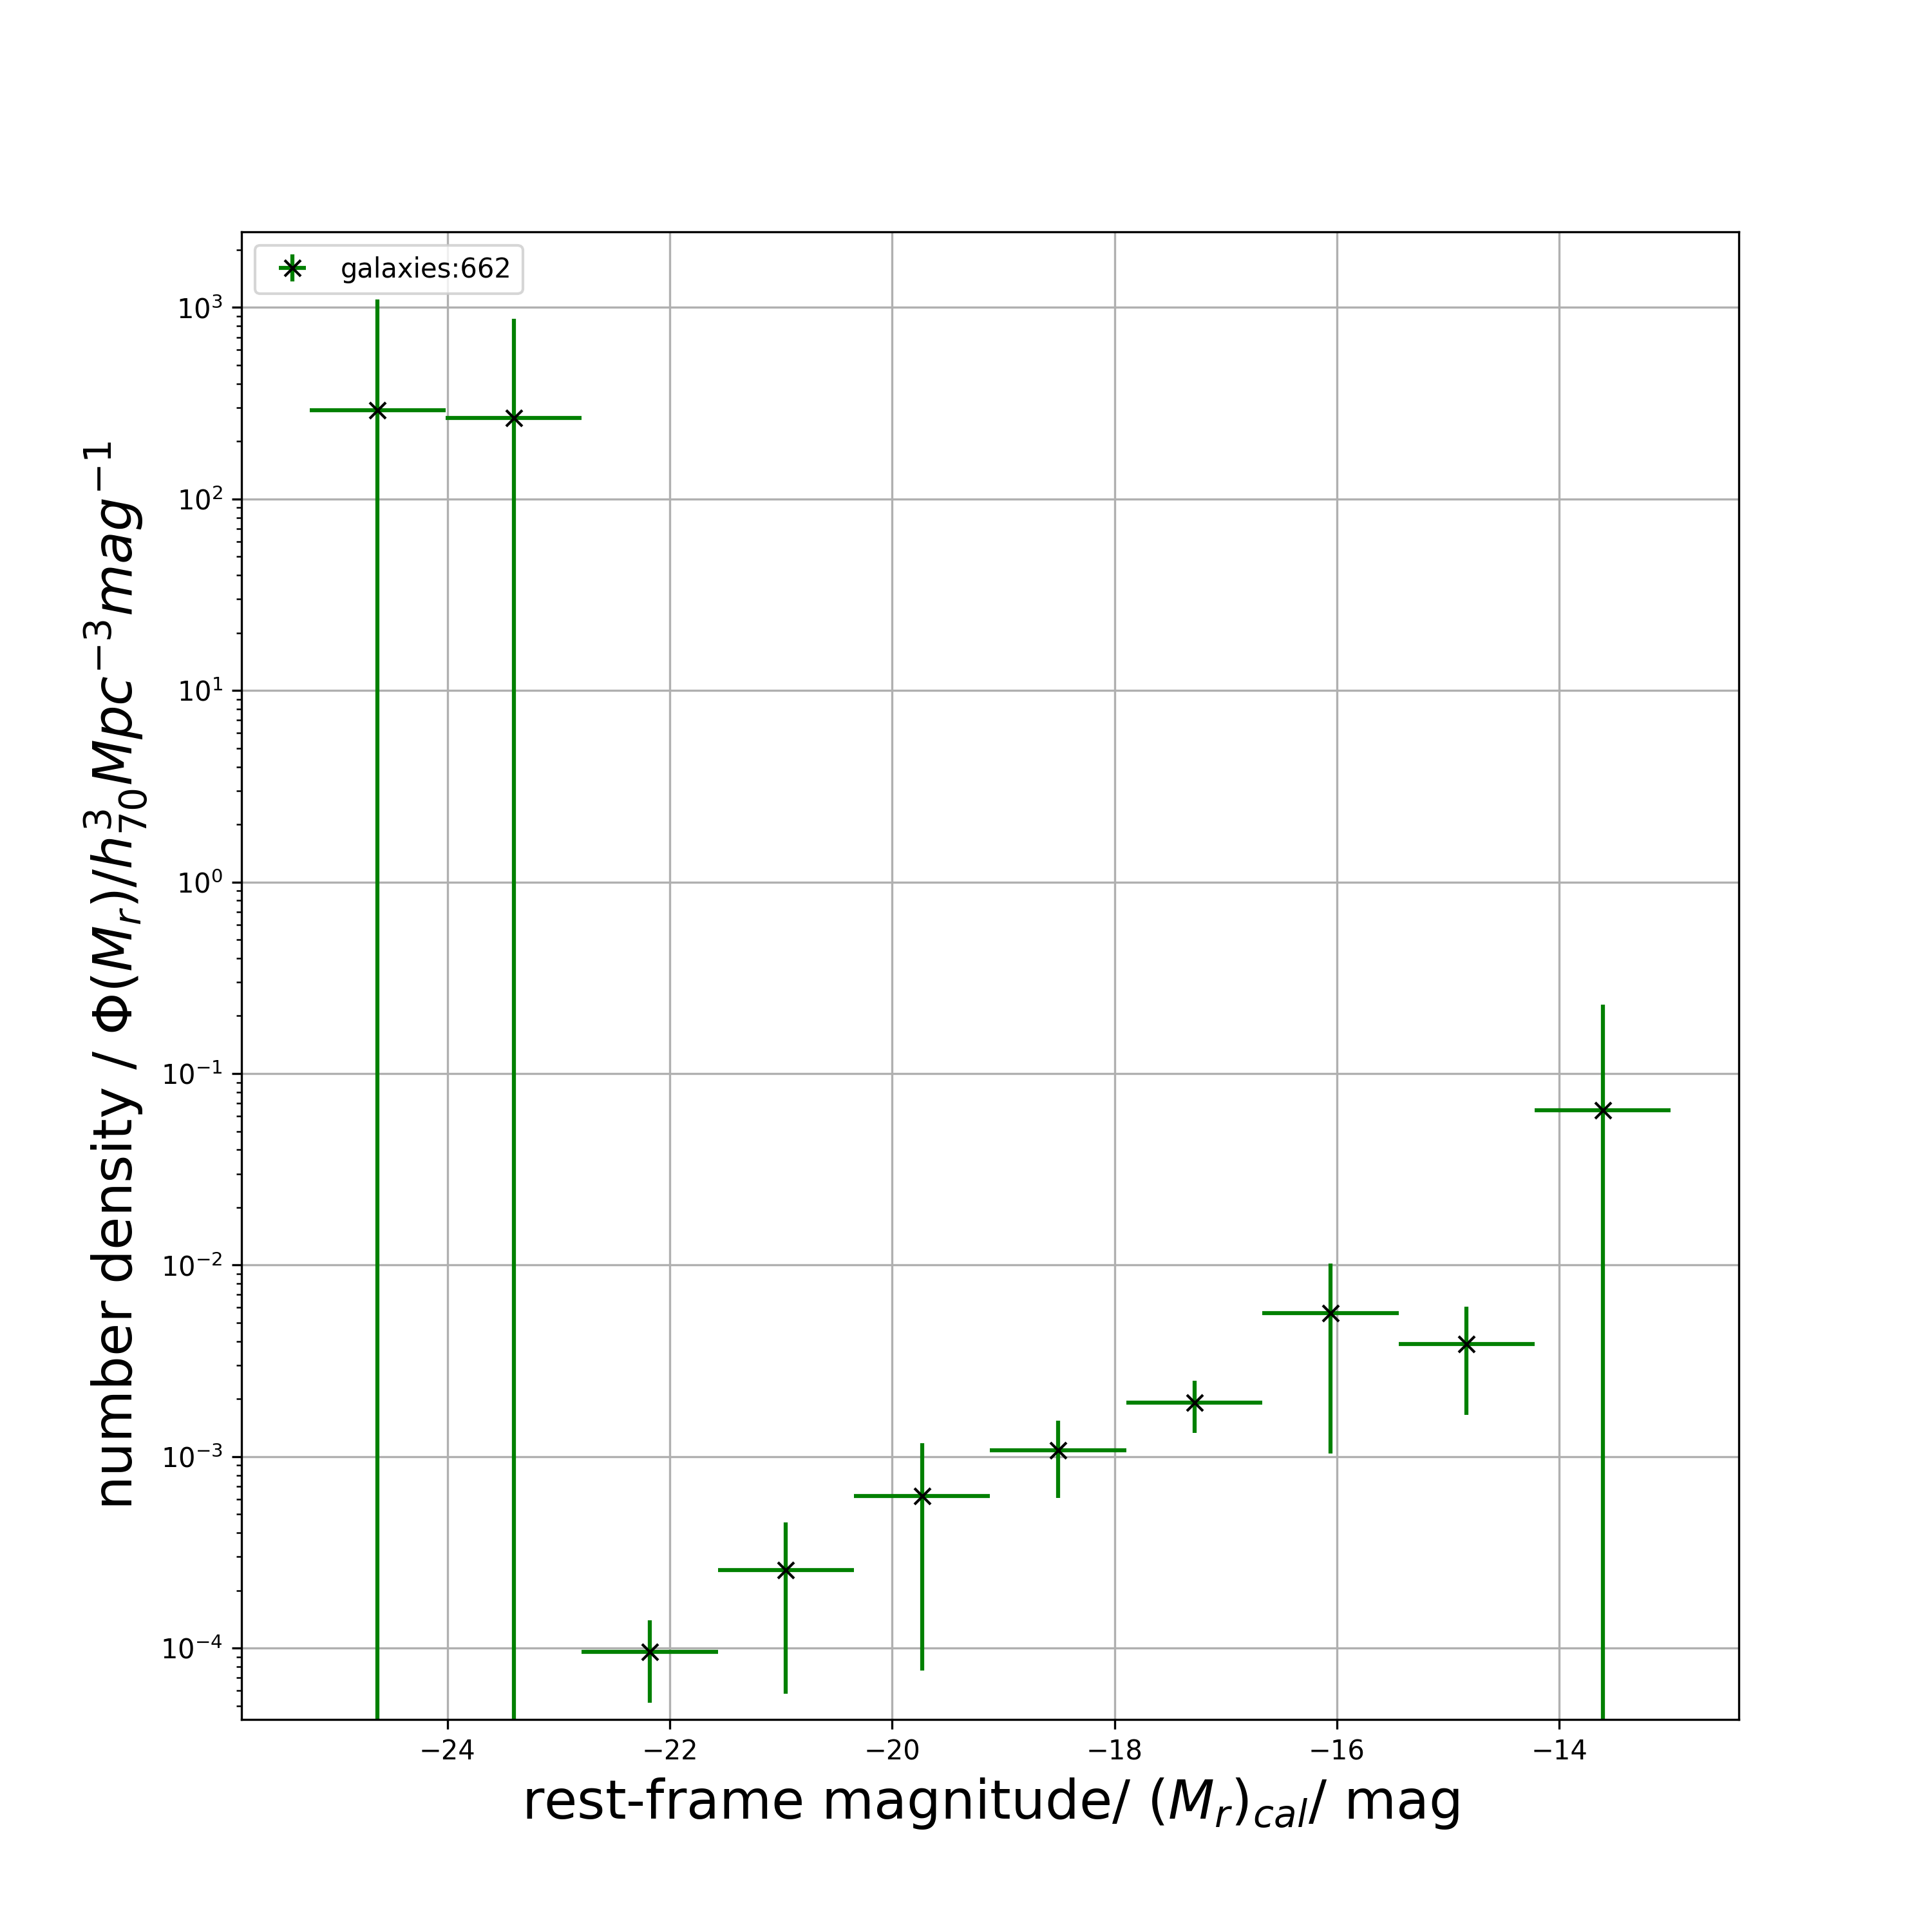
filter_plot_by_colour( ): Study the luminosity function by colour properties by specifying the colour dichotomy
Calculate rest-frame magnitudes in a higher wavelength band.
g_maggy_ratios_table = pd.read_csv('rest_maggy_ratios_g_ugriz_test.csv', delimiter=' ')
g_maggy_ratio_list = np.array(g_maggy_ratios_table['maggy_ratio'])

g_rest_mag_list = lf.get_rest_mag(z_photo_list, g_app_mag_list, g_maggy_ratio_list)
Plot the weighted luminosity function from data, binned by magnitude and filtered by galaxy colours. The galaxy colours are filtered by red and blue with the help of the input colour dichotomy line parameters. The colour dichotomy line parameters must be inferred first from a CMD plot.
colour_cut_slope = 0.0
colour_cut_intercept = 0.65
all_M_list, all_M_err_list, all_phi_list, all_phi_err_list, red_M_list, red_M_err_list, red_phi_list, red_phi_err_list, blue_M_list, blue_M_err_list, blue_phi_list, blue_phi_err_list = lf.filter_plot_by_colour(
    colour_cut_slope,
    colour_cut_intercept,
    r_rest_mag_list,
    g_rest_mag_list,
    Vmax_list,
    n_bins,
    RA_list,
    Dec_list,
    n_patches,
    ugriz_test_patch_centers_file_path,
    survey='kids',
    numba_installed=True,
    plot_savename='test_LF_colour.png')

print(all_M_list)
# returns
# [-24.62894309 -23.40451281 -22.18008254 -20.95565226 -19.73122199
#  -18.50679171 -17.28236144 -16.05793116 -14.83350089 -13.60907061]
print(all_M_err_list)
# returns
# [0.61221514 0.61221514 0.61221514 0.61221514 0.61221514 0.61221514
#  0.61221514 0.61221514 0.61221514 0.61221514]
print(all_phi_list)
# returns
# [2.90491673e+02 2.65797786e+02 9.55747321e-05 2.54944447e-04
#  6.24753189e-04 1.07591651e-03 1.91052839e-03 5.62455612e-03
#  3.86037842e-03 6.41768497e-02]
print(all_phi_err_list)
# returns
# [8.10939765e+02 6.07817000e+02 4.36417469e-05 1.97040124e-04
#  5.48618065e-04 4.65431861e-04 5.77332857e-04 4.59036072e-03
#  2.21037277e-03 1.64362438e-01]
print(red_M_list)
# returns
# [-23.74970541 -23.22313054 -22.69655567 -22.1699808  -21.64340593
#  -21.11683106 -20.59025618 -20.06368131 -19.53710644 -19.01053157]
print(red_M_err_list)
# returns
# [0.26328744 0.26328744 0.26328744 0.26328744 0.26328744 0.26328744
#  0.26328744 0.26328744 0.26328744 0.26328744]
print(red_phi_list)
# returns
# [5.26222015e-06 1.14632290e-05 2.28157661e-05 3.06324489e-05
#  3.78476037e-05 6.95586501e-05 4.60187630e-05 4.22375487e-05
#  1.62668295e-04 5.19891936e-05]
print(red_phi_err_list)
# returns
# [1.68168015e-05 1.88488251e-05 2.14158070e-05 3.71536660e-05
#  5.64450184e-05 3.68156206e-05 5.65680558e-05 7.50190249e-05
#  1.53845192e-04 2.11279153e-04]
print(blue_M_list)
# returns
# [-24.62894309 -23.40451281 -22.18008254 -20.95565226 -19.73122199
#  -18.50679171 -17.28236144 -16.05793116 -14.83350089 -13.60907061]
print(blue_M_err_list)
# returns
# [0.61221514 0.61221514 0.61221514 0.61221514 0.61221514 0.61221514
#  0.61221514 0.61221514 0.61221514 0.61221514]
print(blue_phi_list)
# returns
# [2.90491673e+02 2.65797776e+02 6.60187386e-05 1.98062249e-04
#  5.36631986e-04 1.05355819e-03 1.91052839e-03 5.62455612e-03
#  3.86037842e-03 6.41768497e-02]
print(blue_phi_err_list)
# returns
# [8.10939766e+02 6.07817001e+02 3.09642048e-05 1.36828177e-04
#  5.48267776e-04 4.41552058e-04 5.12621058e-04 4.59003142e-03
#  2.20983143e-03 1.64360385e-01]


# displays plot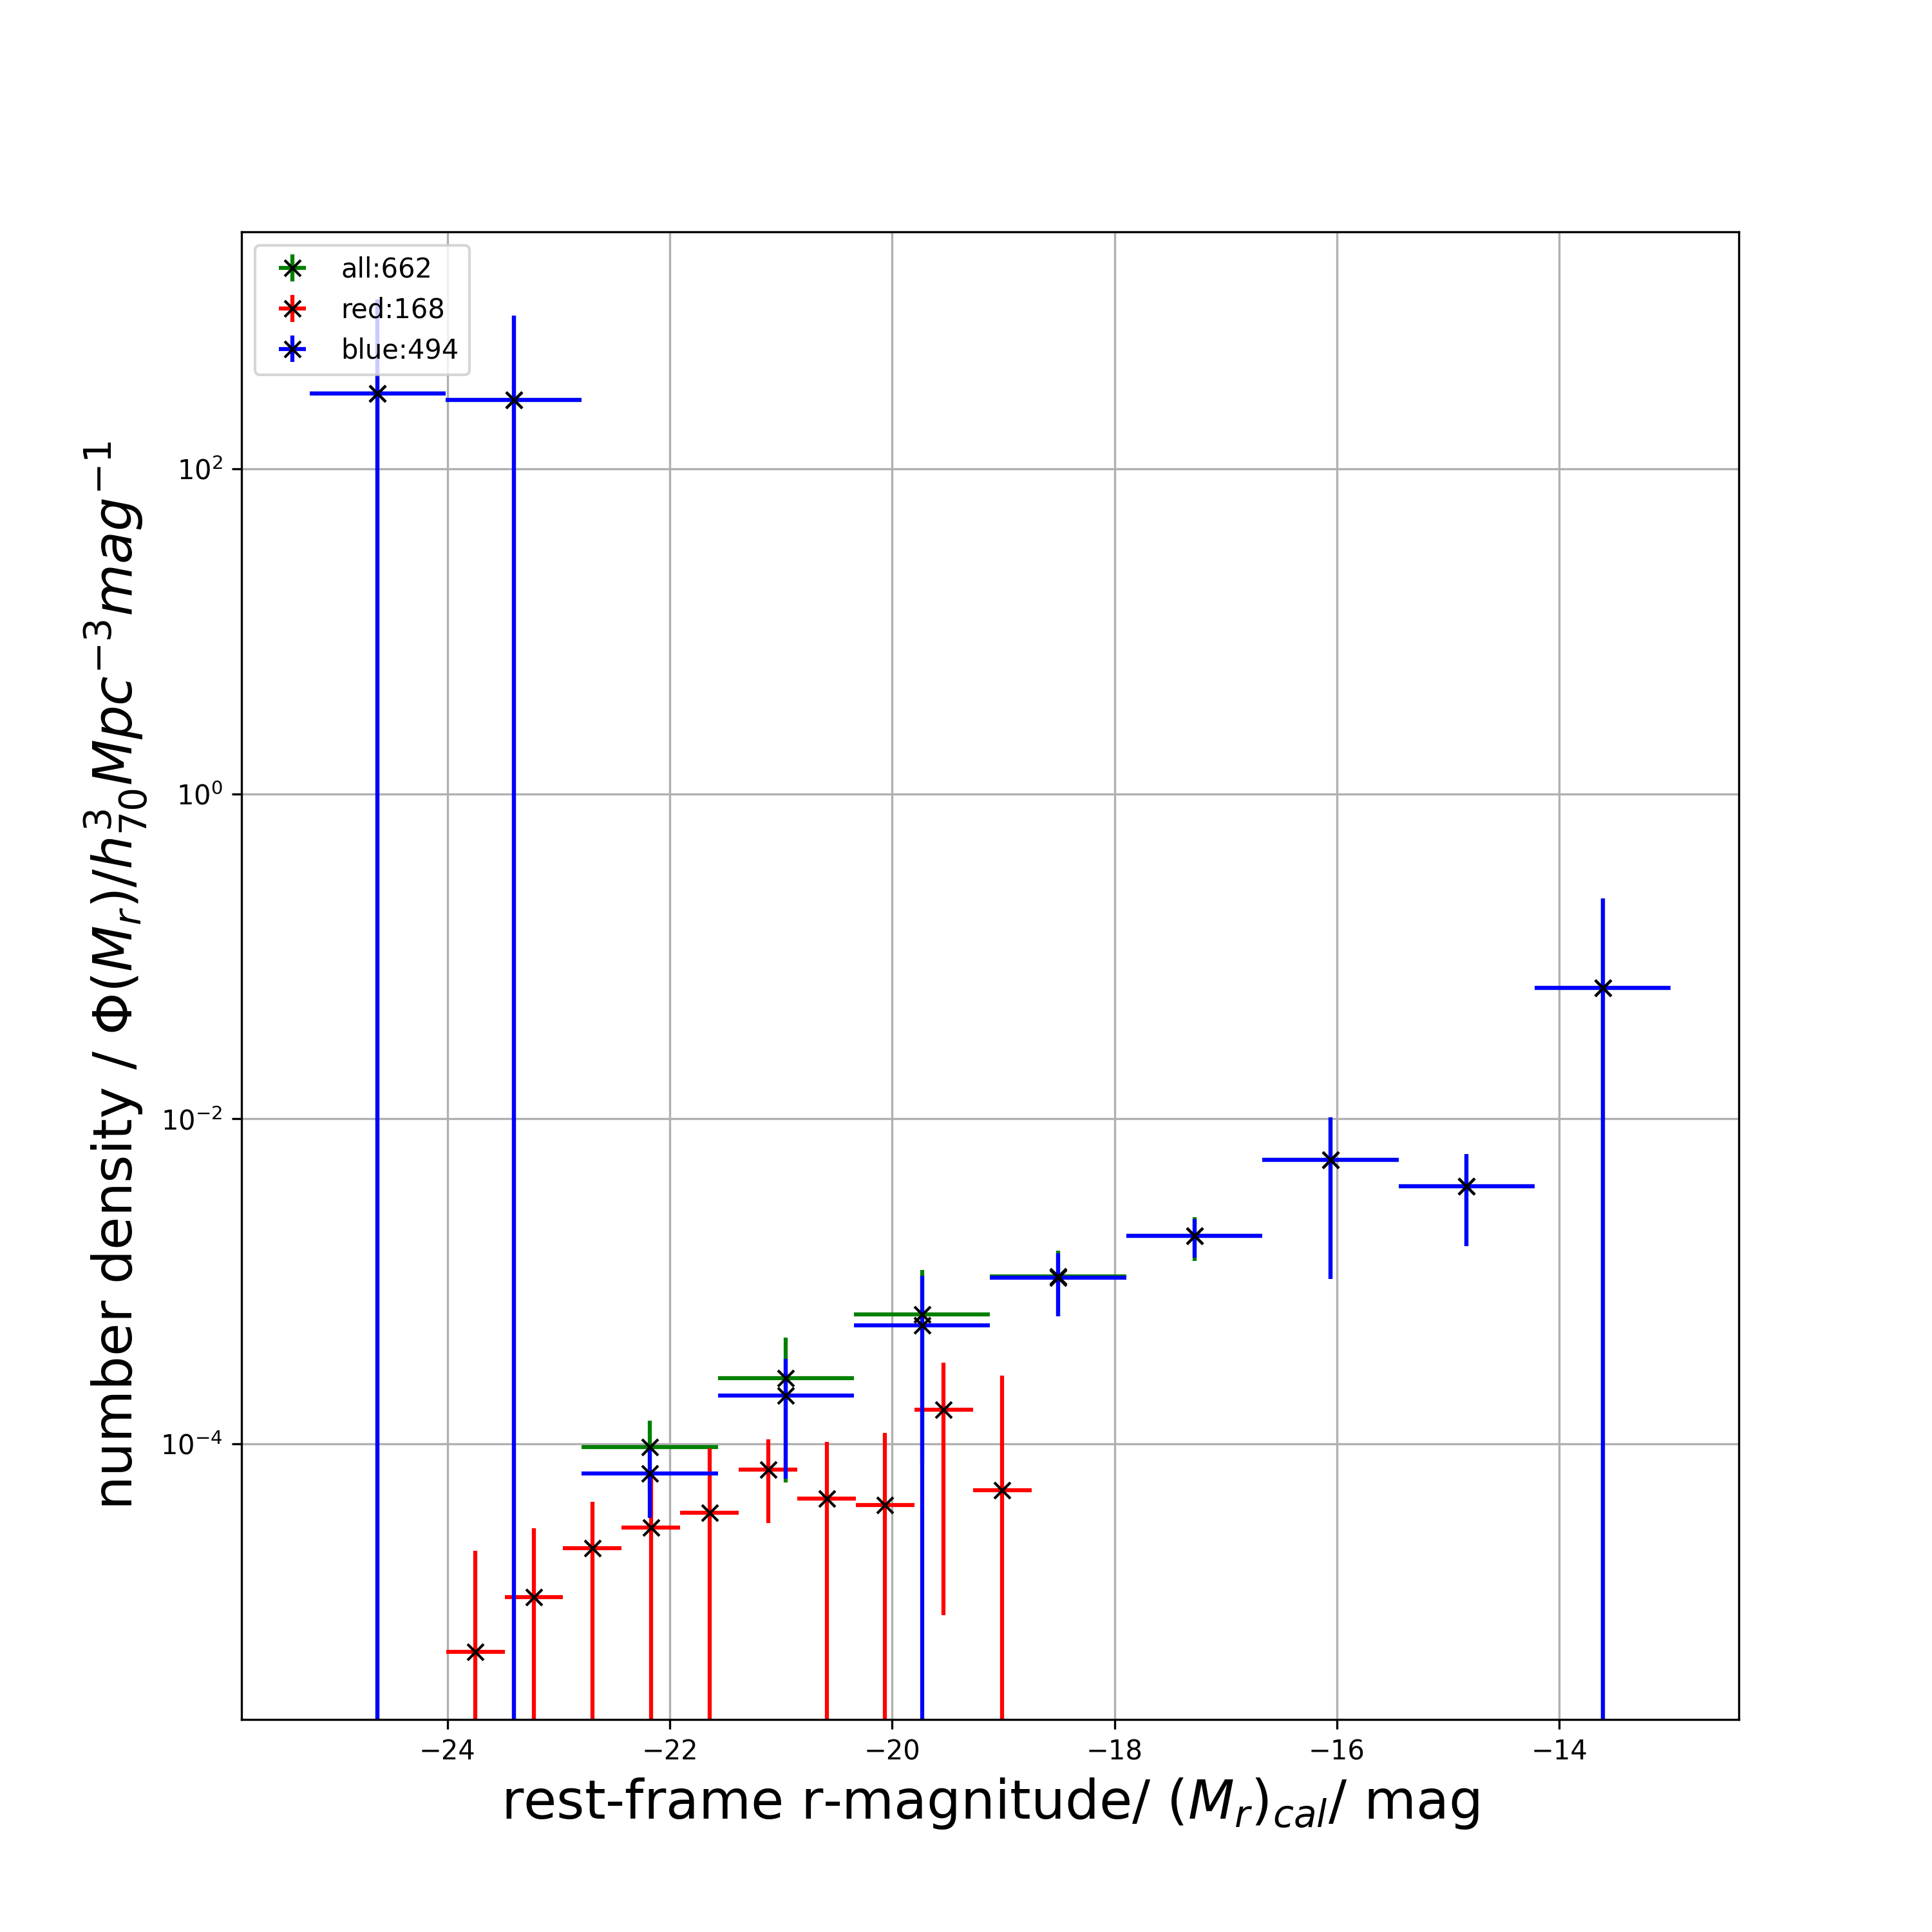
SchechterMagModel( )
Return single Schechter luminosity function in terms of magnitude from 3 free parameters of the model.
M_star_guess = -20.7
phi_star_guess = 9.5e-3
alpha_guess = -1.3
sch1_model_phi_list = lf.SchechterMagModel(M_list, M_star_guess, phi_star_guess, alpha_guess)
print(sch1_model_phi_list)
# returns
# [1.88907752e-19 2.36778419e-08 1.16643327e-04 2.29997398e-03
#  7.59124212e-03 1.40466857e-02 2.15508182e-02 3.11177839e-02
#  4.40579218e-02 6.19837431e-02]
DoubleSchechterMagModel( )
Return double Schechter luminosity function in terms of magnitude from 5 free parameters of the model.
M_star_guess = -20.7
phi_star_1_guess = 6.16e-3
alpha_1_guess = -0.79
phi_star_2_guess = 6.16e-3
alpha_2_guess = -0.79
sch2_model_phi_list = lf.DoubleSchechterMagModel(M_list,
                                              M_star_guess,
                                              phi_star_1_guess,
                                              alpha_1_guess,
                                              phi_star_2_guess,
                                              alpha_2_guess)
print(sch2_model_phi_list)
# returns
# [1.55110526e-18 1.09383000e-07 3.03168335e-04 3.36328048e-03
#  6.24552903e-03 6.50199270e-03 5.61245148e-03 4.55946326e-03
#  3.63199542e-03 2.87485077e-03]
get_gof( ): Estimate the goodness of the fit by the reduced chi square, 
Returns reduced chi squared estimate of goodness of fit from observed values, modelled values, errors and number of free parameters used in model.
m = 3
gof = lf.get_gof(phi_list, phi_err_list, sch1_model_phi_list, m)
print(gof)
# returns
# 366.43103358282144
get_schechter_phi( ): Least square fit single Schechter function on data and plot
Returns least square fit of phi with single Schechter function, reduced chi squared estimate and the 3 Schechter parameters with their errors.
all_sch1_model_phi_list, all_chi_sq, all_M_star, all_M_star_err, all_phi_star, all_phi_star_err, all_alpha_star, all_alpha_star_err = lf.get_schechter_phi(
    all_M_list,
    all_M_err_list,
    all_phi_list,
    all_phi_err_list,
    np.array([M_star_guess, phi_star_guess, alpha_guess]),
    plot_savename='test_all_Sch.png')

print(all_sch1_model_phi_list)
# returns
# [2.83258986e-09 5.74389144e-06 9.25939975e-05 3.12011592e-04
#  6.33385107e-04 1.09120816e-03 1.78269412e-03 2.86270542e-03
#  4.57149418e-03 7.28713338e-03]
print(all_chi_sq)
# returns
# 0.14910742282850892
print(all_M_star)
# returns
# -22.068531742285295
print(all_M_star_err)
# returns
# 0.35573470148190917
print(all_phi_star)
# returns
# 0.0003176940137059405
print(all_phi_star_err)
# returns
# 0.0001288373384458377
print(all_alpha_star)
# returns
# -1.4126892538229192
print(all_alpha_star_err)
# returns
# 0.06081125190828317

# displays plot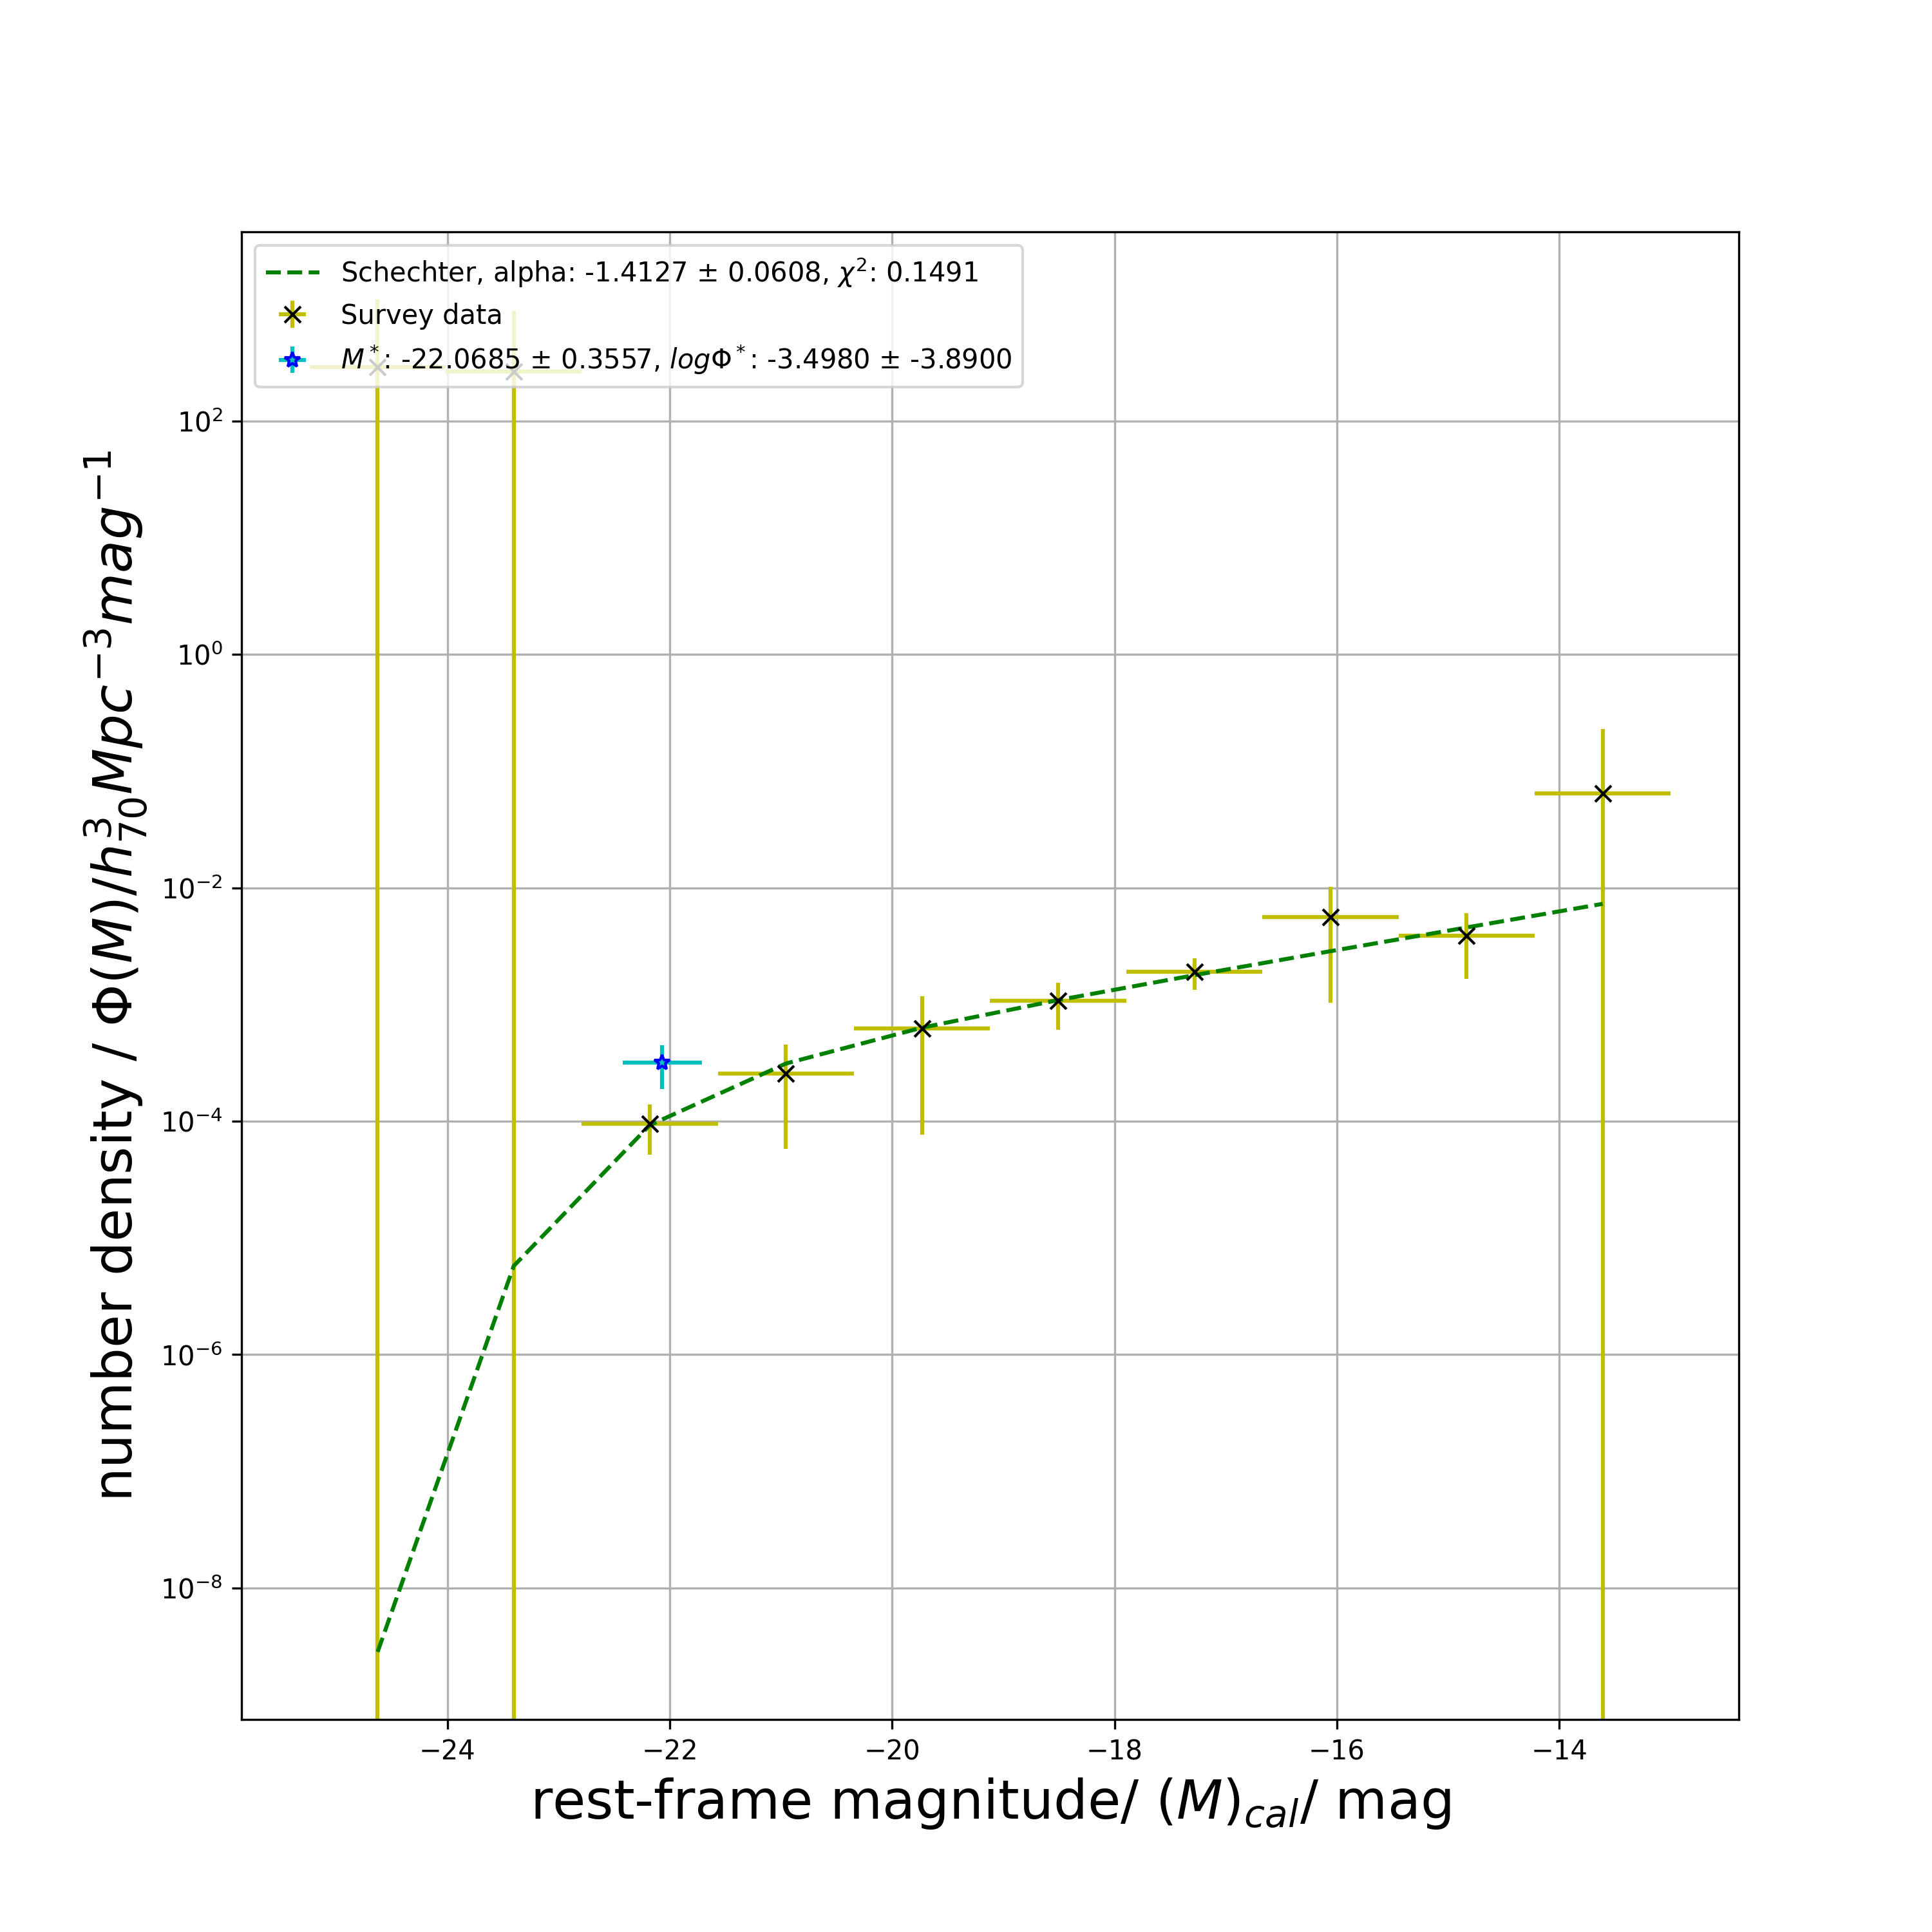
blue_sch1_model_phi_list, blue_chi_sq, blue_M_star, blue_M_star_err, blue_phi_star, blue_phi_star_err, blue_alpha_star, blue_alpha_star_err = lf.get_schechter_phi(
    blue_M_list,
    blue_M_err_list,
    blue_phi_list,
    blue_phi_err_list,
    np.array([M_star_guess, phi_star_guess, alpha_guess]),
    plot_savename='test_blue_Sch.png')

print(blue_sch1_model_phi_list)
# returns
# [1.98420348e-10 2.18093482e-06 6.21018522e-05 2.57111492e-04
#  5.70169944e-04 1.03300833e-03 1.75300151e-03 2.91245392e-03
#  4.80570005e-03 7.91206256e-03]
print(blue_chi_sq)
# returns
# 0.18163420708695324
print(blue_M_star)
# returns
# -21.842075975175316
print(blue_M_star_err)
# returns
# 0.31845816378631797
print(blue_phi_star)
# returns
# 0.0003029586014597913
print(blue_phi_star_err)
# returns
# 0.00012126827264875354
print(blue_alpha_star)
# returns
# -1.4411669183679228
print(blue_alpha_star_err)
# returns
# 0.06358938020533868

# displays plot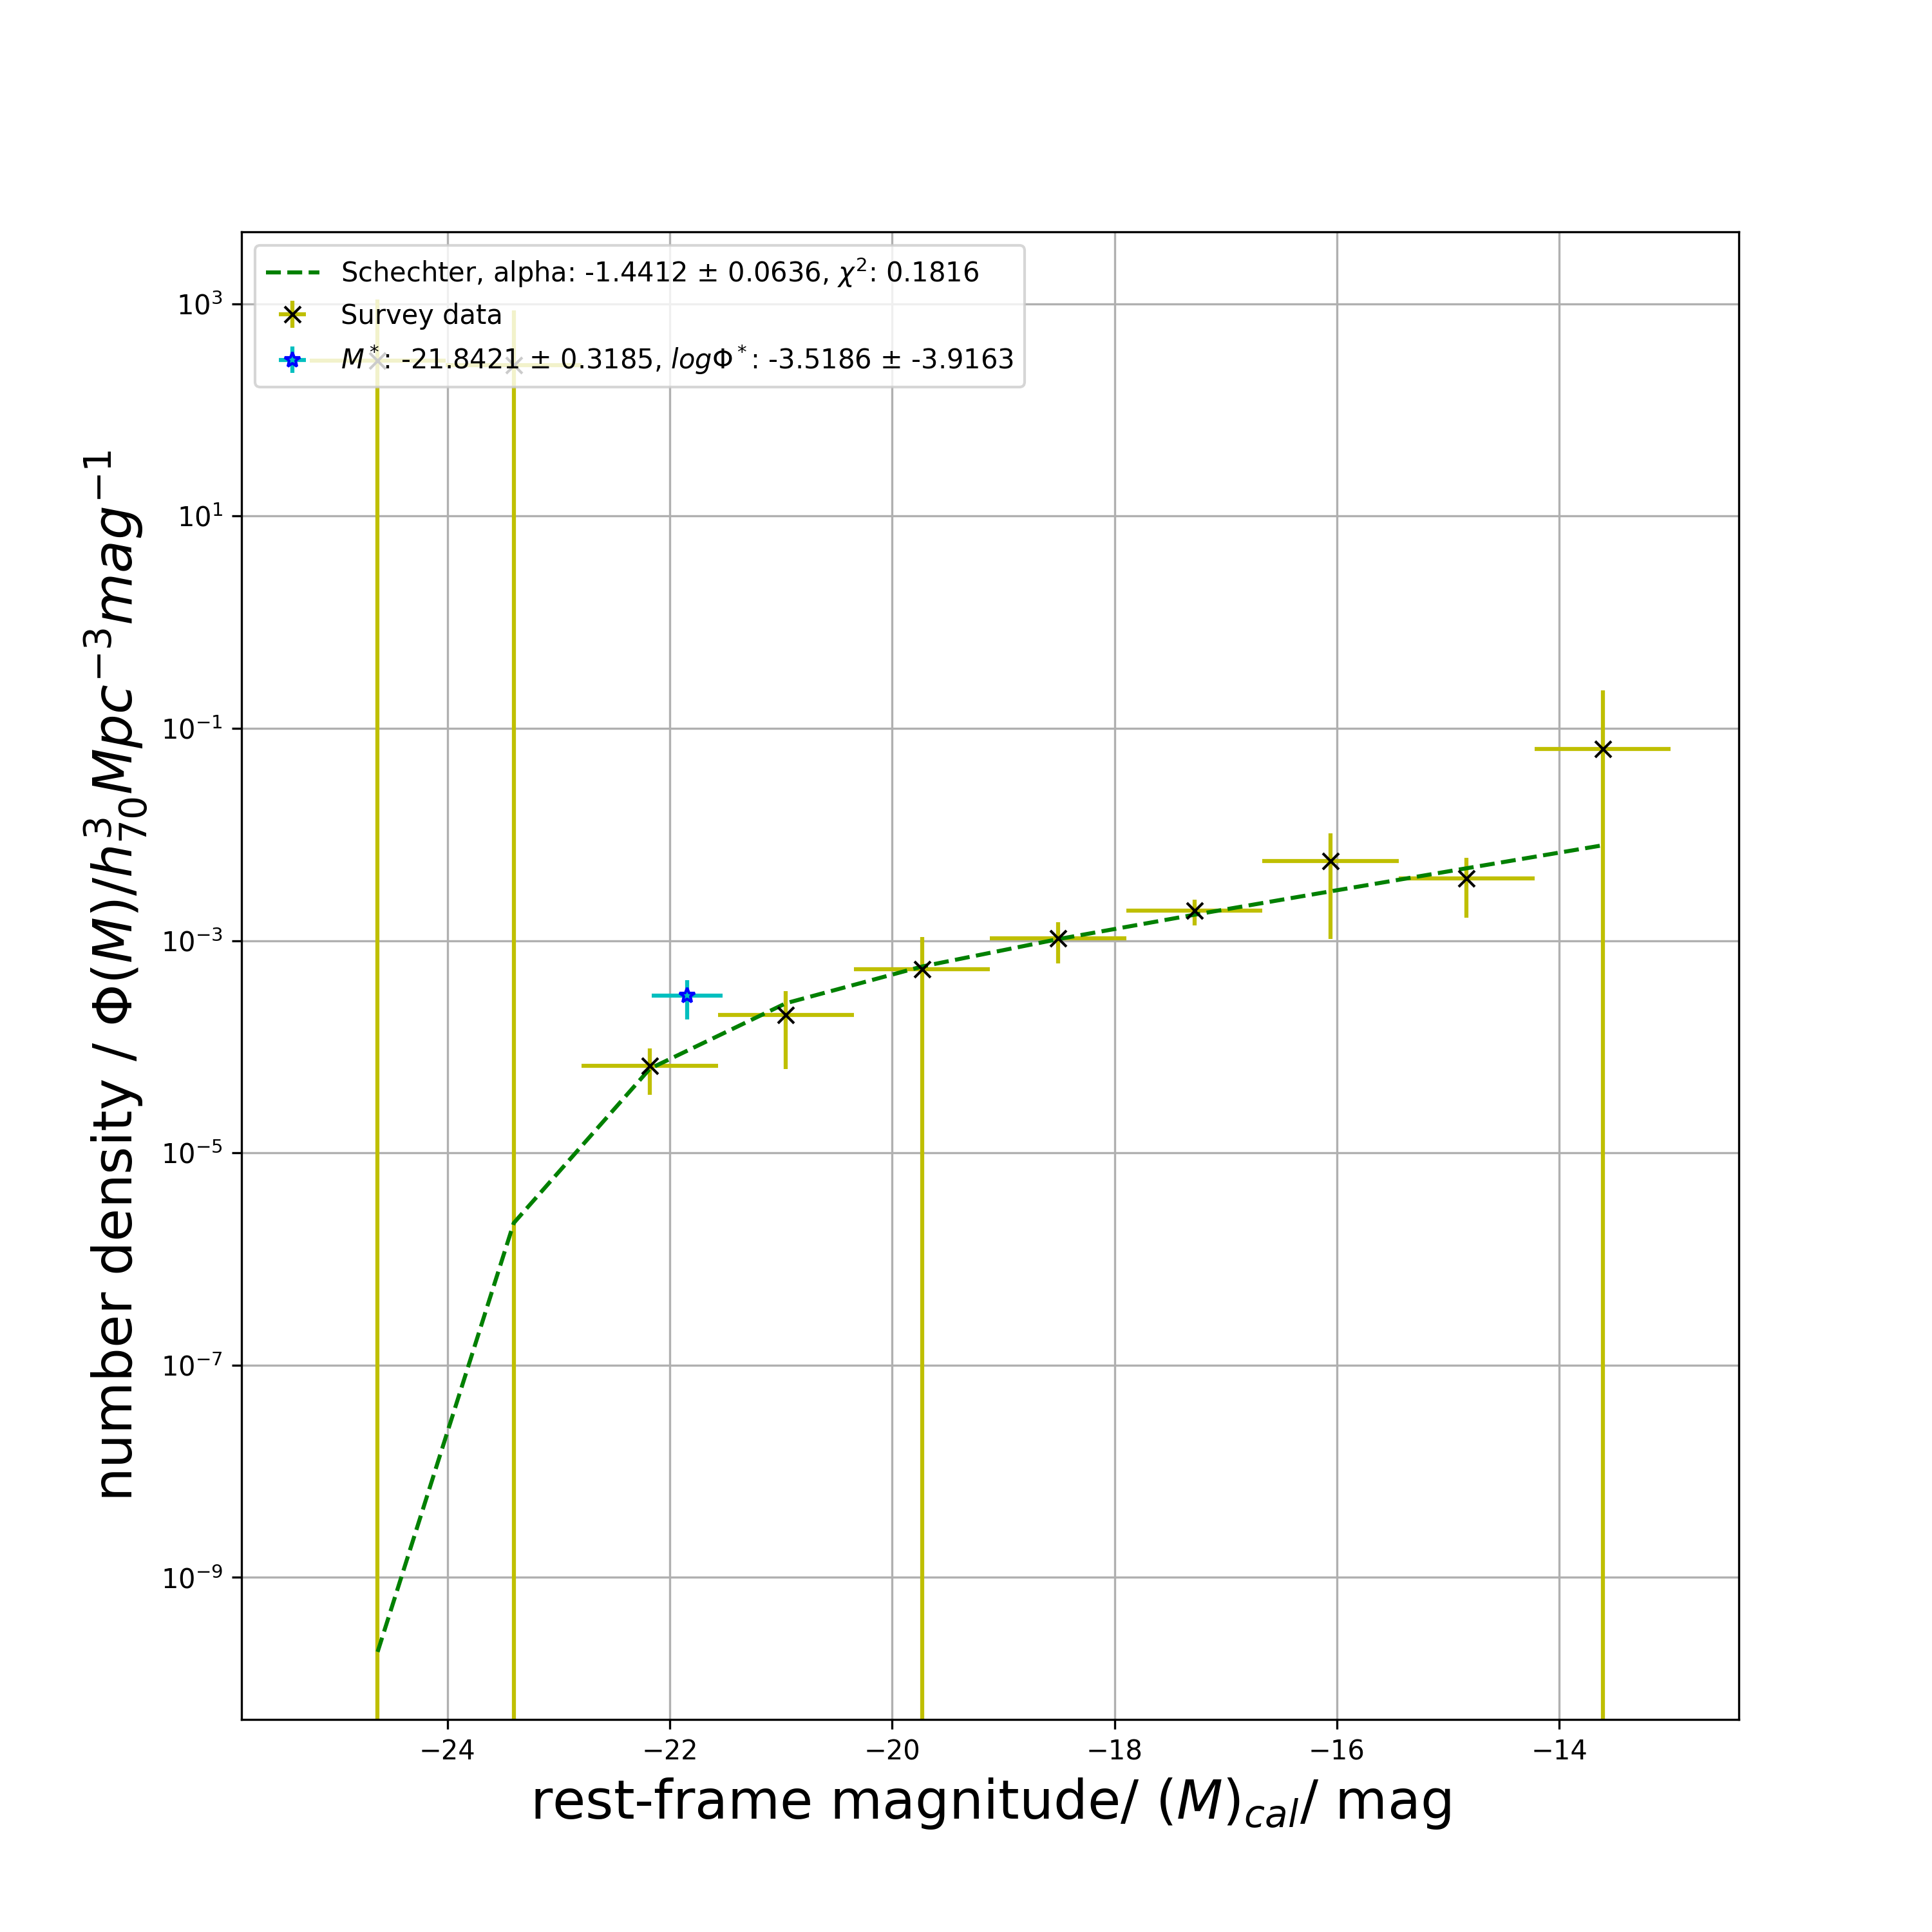
get_double_schechter_phi( ): Least square fit double Schechter function on data and plot
Returns least square fit of phi with double Schechter function, reduced chi squared estimate and the 5 Schechter parameters with their errors.
red_sch2_model_phi_list, red_chi_sq, red_M_star, red_M_star_err, red_phi_star_1, red_phi_star_err_1, red_phi_star_2, red_phi_star_err_2, red_alpha_star_1, red_alpha_star_err_1, red_alpha_star_2, red_alpha_star_err_2 = lf.get_double_schechter_phi(
    red_M_list,
    red_M_err_list,
    red_phi_list,
    red_phi_err_list,
    np.array([M_star_guess, phi_star_1_guess, alpha_1_guess, phi_star_2_guess, alpha_2_guess]),
    plot_savename='test_red_dSch.png')

print(red_sch2_model_phi_list)
# returns
# [0.00000000e+000 0.00000000e+000 0.00000000e+000 0.00000000e+000
#  0.00000000e+000 0.00000000e+000 0.00000000e+000 2.63752933e-229
#  2.35253203e-141 2.75200955e-087]
print(red_chi_sq)
# returns
# 1.2084645603920292
print(red_M_star)
# returns
# -13.256557144101373
print(red_M_star_err)
# returns
# inf
print(red_phi_star_1)
# returns
# -0.005143924152379018
print(red_phi_star_err_1)
# returns
# inf
print(red_phi_star_2)
# returns
# -1.8735454729853815
print(red_phi_star_err_2)
# returns
# inf
print(red_alpha_star_1)
# returns
# 0.012183946742584995
print(red_alpha_star_err_1)
# returns
# inf
print(red_alpha_star_2)
# returns
# 0.025603076393042268
print(red_alpha_star_err_2)
# returns
# inf

# displays plot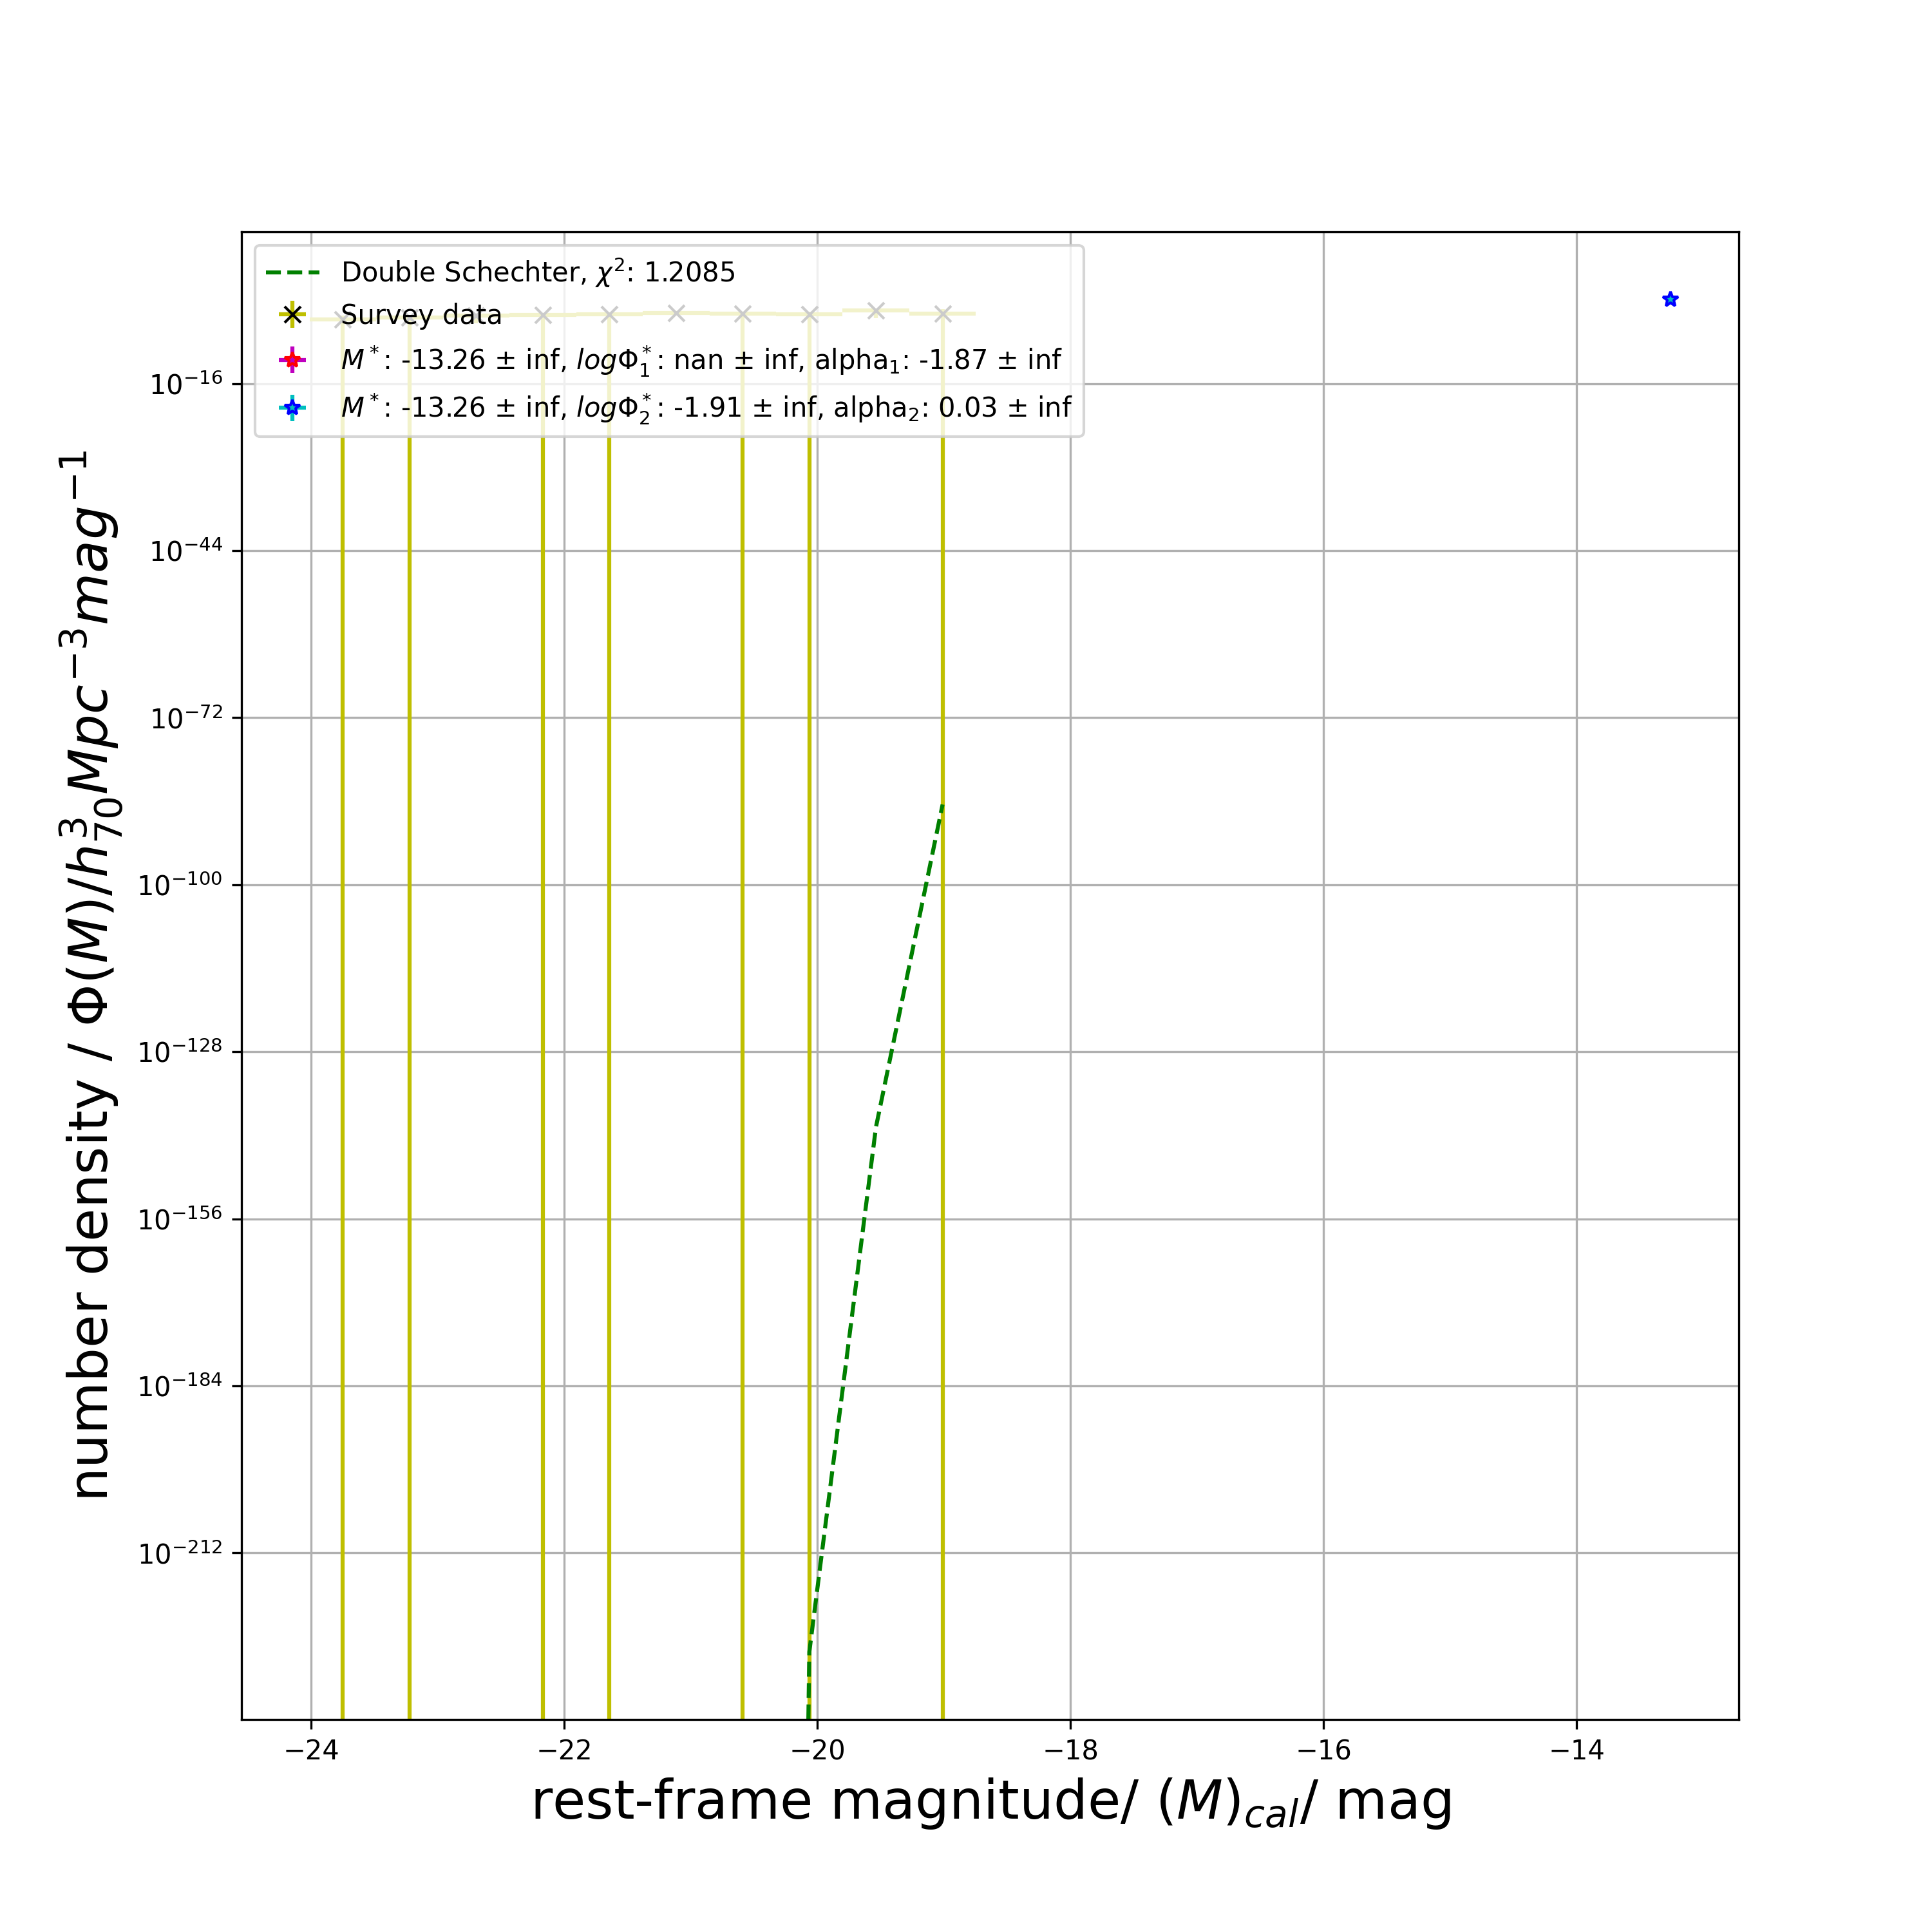


Pull requests are welcome. For major changes, please open an issue first to discuss what you would like to change.
Please make sure to update tests as appropriate.